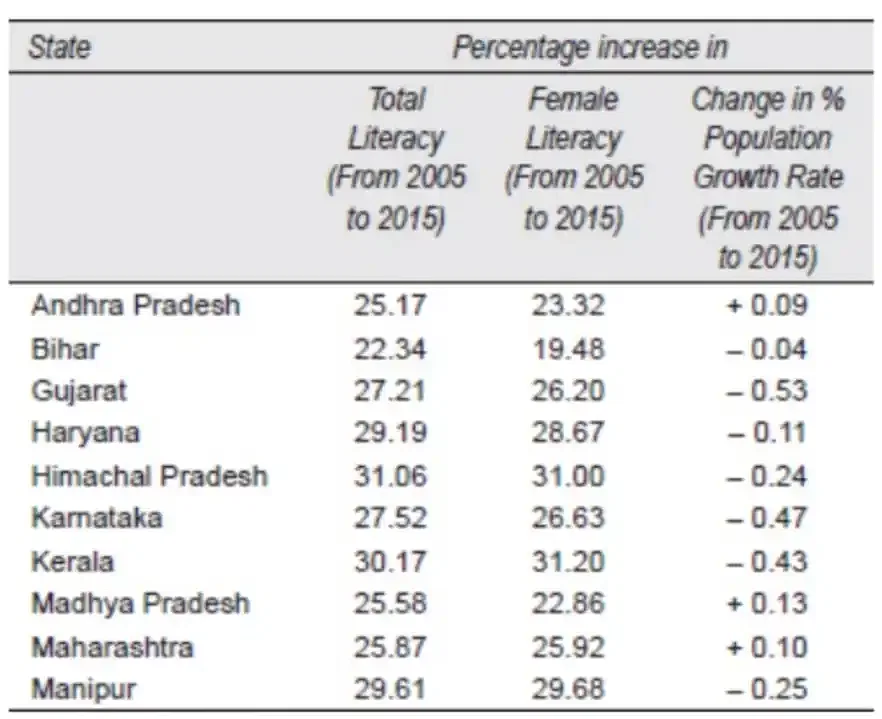
CAT October 17 Data Interpretation Practice Questions 2024 From Tables: The Data Interpretation Practice Questions from tables have been provided below for the student's to practice on October 17, 2024. The CAT October 17 Data Interpretation Practice Questions 2024 From Tables are available here for the student's reference. Students who are planning to appear for CAT 2024 can go through the available questions to enhance their performance.
Also Read |
- CAT October 10 Data Interpretation Practice Questions 2024 From Bar Charts
- CAT October 11 Data Interpretation Practice Questions 2024 From Bar Charts
- CAT October 9 Data Interpretation Practice Questions 2024 From Bar Charts
- CAT October 7 Data Interpretation Practice Questions 2024 From Bar Charts
- CAT October 16 Data Interpretation Practice Questions 2024 From Bar Charts
CAT October 17 Data Interpretation Practice Questions 2024 From Tables
Students can check the CAT October 17 Data Interpretation Practice Questions 2024 From Tables here for their reference.

State-wise Literacy and Population Growth
Q1. Which state's growth in female literacy % is greater than the increase in total literacy percentage?
- Maharashtra
- Himachal Pradesh
- Kerala
- Karnataka
- (i) only
- (i), (ii) and (iv)
- (i) and (iii)
- All of the above
Q2. The numerical ratio of the % increase in total literacy to the change in the percentage population growth rate is almost (take absolute values only) for the state with the lowest percentage increase in literacy.
- 508.5
- 558.5
- 598.5
- None of these
Q3. Which state has the highest ratio of the percentage rise in female literacy to the % increase in total literacy?
- Kerala
- Maharashtra
- Manipur
- Madhya Pradesh
Q4. The percentage increase in female literacy in those states where the percentage increase exceeds the overall average is calculated as the ratio of the overall simple average to the state-specific simple average.
- 0.972
- 0.818
- 0.89
- 0.146
Note that the provided CAT October 17 Data Interpretation Practice Questions 2024 From Tables have been extracted from multiple references including Arun Sharma.
Also Check |
- CAT October 10 Quantitative Aptitude Practice Questions 2024 From Arithmetic
- CAT October 7 Quantitative Aptitude Practice Questions 2024 From Arithmetic
- CAT October 9 Quantitative Aptitude Practice Questions 2024 From Arithmetic
- CAT October 11 Quantitative Aptitude Practice Questions 2024 From Arithmetic
- CAT October 16 Quantitative Aptitude Practice Questions 2024 From Arithmetic
- CAT October 17 Quantitative Aptitude Practice Questions 2024 From Number System
